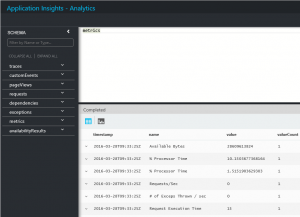
For the last couple of months I’ve been using Application Insights to monitor, detect and diagnose performance issues in our applications. Last week I noticed that the Analytics button on the Application Insights blade was working:
Once you click it, your browser will open the Application Insights Analytics page with the following taxonomy:
- A left panel (named SCHEMA) which shows all the tables you can use to query the telemetry from your applications.
- A top panel where you must write your queries.
- And a bottom panel to show the query results or charts.
Yes you read it right: **You can query your telemetry!**
To write your queries you must use the Insights Query Language and start with a source table followed by a series of operators separated by |.
The following example is a simple query that will render a pie chart with the average Requests/Sec served by role instances (servers):
    metrics
    | where name == "Requests/Sec"
    | project value, cloud_RoleInstance
    | summarize avg(value) by cloud_RoleInstance
| render piechart- Line 1 specifies the metrics table as the source of the query.
- Line 2 uses the where operator to filter the table.
- Line 3 selects the columns to include using the project operator.
- Line 4 calculates the average of the metric by cloud_RoleInstance (server)
- Line 5 renders the results as a pie chart.
You must be thinking: do I have to learn another language? The short answer is yes! But it’s nothing you won’t be able to handle and once you get used to it, you will unleash the full power of the queries and gain a better understanding of your applications. For instances now we can answer the following questions:
- What method of our application throws more exceptions?
- What exceptions are related to a given user?
- What pages are being used and which ones are not?
To learn much more you can visit the Queries in Analytics page which is a great resource and is well organized.
Hope it helps.


